_2026@2x.png?width=50&height=50&name=TPRC-Signet-(Deep)_2026@2x.png "TPRC-Signet-(Deep)_2026@2x")
_2026@2x.png?width=50&height=50&name=TPRC-Signet-(Pebble)_2026@2x.png)
Diagnostic
Every employee on the team or project completes the people readiness assessment. Results are summarized at the team and organizational level to establish the readiness baseline.
A readiness score at the team and organizational level. Individual profiles stay private to the person. Leadership receives a full debrief with the baseline data and an initial gap analysis.

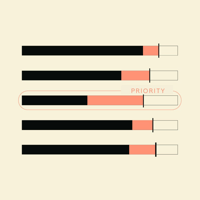
Gap analysis
We walk leadership through the results. Together we identify where readiness is lowest and where building it will have the most impact on the current initiative. Development priorities are set on what the data shows, not on assumptions.
A development plan targeted to existing gaps. Clear priorities for the next ten weeks.
.png?width=2187&height=2189&name=TPRC-Slider-02gap@2x%20(new).png)
Development
Employees complete a short daily check-in that takes five to ten minutes. Every two weeks, a facilitated group session brings the team together to work on the specific areas the diagnostic identified. Our coaches track progress across all three instruments.
Live trend data you can check at any time. A facilitation report after each group session. Early signals when a team or individual is losing capacity.

Reassessment
The same assessment from Day 1, repeated. Same people, same instrument. A new baseline is established. The events that shaped the cycle, including strategy shifts, team changes, and external pressure, are mapped against the readiness curve so leadership sees not just where the score moved, but what moved it.
A clear before-and-after picture. The numbers either moved or they did not. Leadership receives a full results debrief.
.png?width=2187&height=2177&name=TPRC-Slider-04Reassessment@2x(new).png)
Ongoing cycle
The cycle starts again. New priorities. New baseline. Readiness becomes a continuous metric, not a one-time project.
A score that stays current as the work changes. A team that keeps building. Data that compounds across cycles.
Same rhythm. Same investment each cycle.

Diagnostic
Every employee on the team or project completes the people readiness assessment. Results are summarized at the team and organizational level to establish the readiness baseline.
A readiness score at the team and organizational level. Individual profiles stay private to the person. Leadership receives a full debrief with the baseline data and an initial gap analysis.
From your people: 10 minutes, once.
From leadership: one 60-minute debrief.

Gap analysis
We walk leadership through the results. Together we identify where readiness is lowest and where building it will have the most impact on the current initiative. Development priorities are set on what the data shows, not on assumptions.
A development plan targeted to existing gaps. Clear priorities for the next ten weeks.
From your people: none.
From leadership: one 60-minute session.

Development
Employees complete a short daily check-in that takes five to ten minutes. Every two weeks, a facilitated group session brings the team together to work on the specific areas the diagnostic identified. Our coaches track progress across all three instruments.
Live trend data you can check at any time. A facilitation report after each group session. Early signals when a team or individual is losing capacity.
From your people: 5–10 minutes daily plus 45 minutes every two weeks. From leadership: one 10-minute progress update per month, by email.

Reassessment
The same assessment from Day 1, repeated. Same people, same instrument. A new baseline is established. The events that shaped the cycle, including strategy shifts, team changes, and external pressure, are mapped against the readiness curve so leadership sees not just where the score moved, but what moved it.
A clear before-and-after picture. The numbers either moved or they did not. Leadership receives a full results debrief.
From your people: 10 minutes, once.
From leadership: one 60-minute debrief.

Ongoing cycle
The cycle starts again. New priorities. New baseline. Readiness becomes a continuous metric, not a one-time project.
A score that stays current as the work changes. A team that keeps building. Data that compounds across cycles.
Same rhythm. Same investment each cycle.

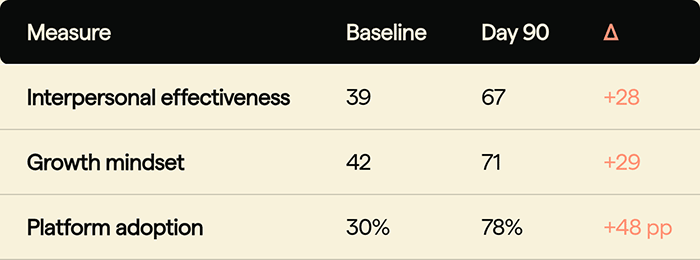
Baseline before the change begins.
Live tracking as demands shift.
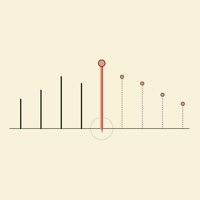
Reassessment at Day 90.
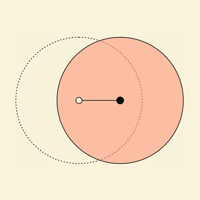
Human context instruments miss.

Adoption moved because readiness moved.
_web.jpg?width=700&name=a-c-Tt0hWd7M7fg-unsplash%20(1)_web.jpg)
